Sunday, January 30, 2011

The China Study II: A look at mortality in the 35-69 and 70-79 age ranges

This post is based on an analysis of a subset of the China Study II data, using HealthCorrelator for Excel (HCE), which is publicly available for download and use on a free trial basis. You can access the original data on the HCE web site, under “Sample datasets”.

HCE was designed to be used with small and individual personal datasets, but it can also be used with larger datasets for multiple individuals.

This analysis focuses on two main variables from the China Study II data: mortality in the 35-69 age range, and mortality in the 70-79 range. The table below shows the coefficients of association calculated by HCE for those two variables. The original variable labels are shown.


One advantage of looking at mortality in these ranges is that they are more likely to reflect the impact of degenerative diseases. Infectious diseases likely killed a lot of children in China at the time the data was being collected. Heart disease, on the other hand, is likely to have killed more people in the 35-69 and 70-79 ranges.

It is also good to have data for both ranges, because factors that likely increased longevity were those that were associated with decreased mortality in both ranges. For example, a factor that was strongly associated with mortality in the 35-69 range, but not the 70-79 range, might simply be very deadly in the former range.

The mortalities in both ranges are strongly correlated with each other, which is to be expected. Next, at the very top for both ranges, is sex. Being female is by far the variable with the strongest, and negative, association with mortality.

While I would expect females to live longer, the strengths of the associations make me think that there is something else going on here. Possibly different dietary or behavioral patterns displayed by females. Maybe smoking cigarettes or alcohol abuse was a lot less prevalent among them.

Markedly different lifestyle patterns between males and females may be a major confounding variable in the China Study sample.

Some of the variables are redundant; meaning that they are highly correlated and seem to measure the same thing. This is clear when one looks at the other coefficients of association generated by HCE.

For example, plant food consumption is strongly and negatively correlated with animal food consumption; so strongly that you could use either one of these two variables to measure the other, after inverting the scale. The same is true for consumption of rice and white flour.

Plant food consumption is not strongly correlated with plant protein consumption; many plant foods have little protein in them. The ones that have high protein content are typically industrialized and seed-based. The type of food most strongly associated with plant protein consumption is white flour, by far. The correlation is .645.

The figure below is based on the table above. I opened a separate instance of Excel, and copied the coefficients generated by HCE into it. Then I built two bar charts with them. The variable labels were replaced with more suggestive names, and some redundant variables were removed. Only the top 7 variables are shown, ordered from left to right on the bar charts in order of strength of association. The ones above the horizontal axis possibly increase mortality in each age range, whereas the ones at the bottom possibly decrease it.


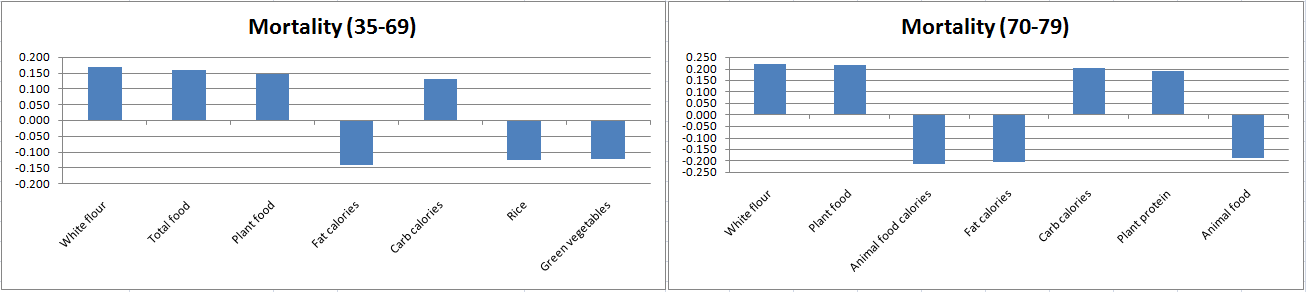
When you look at these results as a whole, a few things come to mind.

White flour consumption doesn’t seem to be making people live longer; nor does plant food consumption in general. For white flour, it is quite the opposite. Plant food consumption reflects white flour consumption to a certain extent, especially in counties where rice consumption is low. These conclusions are consistent with previous analyses using more complex statistics.

Total food is positively associated with mortality in the 35-69 range, but not the 70-79 range. This may reflect the fact that folks who reach the age of 70 tend to naturally eat in moderation, so you don’t see wide variations in food consumption among those folks.

Eating in moderation does not mean practicing severe calorie restriction. This post suggests that calorie restriction doesn't seem to be associated with increased longevity in this sample. Eating well, but not too much, is.

The bar for rice (consumption) on the left chart is likely a mirror reflection of the white flour consumption, so it may appear to be good in the 35-69 range simply because it reflects reduced white flour consumption in that range.

Green vegetables seem to be good when you consider the 35-69 range, but not the 70-79 range.

Neither rice nor green vegetables seem to be bad either. For overall longevity they may well be neutral, with the benefits likely coming from their replacement of white flour in the diet.

Dietary fat seems protective overall, particularly together with animal foods in the 70-79 range. This may simply reflect a delayed protective effect of animal fat and protein consumption.

The protective effect of dietary fat becomes clear when we look at the relationship between carbohydrate calories and fat calories. Their correlation is -.957, which essentially means that carbohydrate intake seriously displaces fat intake.

Carbohydrates themselves may not be the problem, even if coming from high glycemic foods (except wheat flour, apparently). This post shows that they are relatively benign if coming from high glycemic rice, even at high intakes of 206 to 412 g/day. The problem seems to be caused by carbohydrates displacing nutrient-dense animal foods.

Interestingly, rice does not displace animal foods or fat in the diet. It is positively correlated with them. Wheat flour, on the other hand, displaces those foods. Wheat flour is negatively and somewhat strongly correlated with consumption of animal foods, as well as with animal fat and protein.

There are certainly several delayed effects here, which may be distorting the results somewhat.  Degenerative diseases don’t develop fast and kill folks right away. They often require many years of eating and doing the wrong things to be fatal.

Monday, January 10, 2011

How come evolution hasn’t made us immortal? Death, like sex, helps animal populations avoid extinction

Genes do not evolve, nor do traits that are coded for our genes. We say that they evolve to facilitate discourse, which is alright. Populations evolve. A new genotype appears in a population and then either spreads or disappears. If it spreads, then the population is said to be evolving with respect to that genotype. A genotype may spread to an entire population; in population genetics, this is called “fixation”.

(Human chromosomes capped by telomeres, the white areas at the ends. Telomere shortening is caused by oxidative stress, and seems to be associated with death of cells and organisms. Source: Wikipedia.)

Asexual reproduction is very uncommon among animals. The most accepted theory to explain this is that animal populations live in environments that change very quickly, and thus need a great deal of genetic diversity within them to cope with the change. Otherwise they disappear, and so do their genes. Asexual reproduction leads to dramatically less genetic diversity in populations than sexual reproduction.

Asexual reproduction is similar to cloning. Each new individual looks a lot like its single parent. This does not work well in populations where individuals live relatively long lives. And even 1 year may be too long in this respect. It is just too much time to wait for a possible new mutation that will bring in some genetic diversity. To complicate matters, genetic mutation does not occur very often, and most genetic mutations are neutral with respect to the phenotype (i.e., they don’t code for any trait).

This is not so much of a problem for species whose members reproduce extremely fast; e.g., produce a new generation in less than 1 hour. A fast-reproducing species usually has a short lifespan as well. Accordingly, asexual reproduction is common among short-lived and fast-reproducing unicellular organisms and pathogens that have no cell structure like viruses.

Bacteria and viruses, in particular, form a part of the environment in which animals live that require animal populations to have a large amount of genetic diversity. Animal populations with low genetic diversity are unlikely to be able to cope with the barrage of diseases caused by these fast-mutating parasites.

We make sex chiefly because of the parasites.

And what about death? What does it bring to the table for a population?

Let us look at the other extreme – immortality. Immortality is very problematic in evolutionary terms because a population of immortal individuals would quickly outgrow its resources. That would happen too fast for the population to evolve enough intelligence to be able to use resources beyond those that were locally available.

In this post I assume that immortality is not the same as indestructibility. Here immortality is equated to the absence of aging as we know it. In this sense, immortals can still die by accident or due to disease. They simply do not age. For immortals, susceptibility to disease does not go up with age.

One could argue that a population of immortal individuals who did not reproduce would have done just fine. But that is not correct, because in this case immortality would be akin to cloning, but worse. Genetic diversity would not grow, as no mutations would occur. The fixed population of immortals would be unable to cope with fast-mutating parasites.

There is so much selection pressure against immortality in nature that it is no surprise that animals of very few species live more than 60 years on average. Humans are at the high end of the longevity scale. They are there for a few reasons. One is that our ancestors had offspring that required extra care, which led to an increase in the parents’ longevity. The offspring required extra care chiefly because of their large brains.

That increase in longevity was likely due to genetic mutations that helped our ancestors extend a lifespan that was programmed to be relatively short. Immortality is not a sound strategy for population survival, and thus there are probably many mechanisms through which it is prevented.

Death is evolution’s main ally. Sex is a very good helper. Both increase genetic diversity in populations.

We can use our knowledge of evolution to live better today. The aging clock can be slowed significantly via evolutionarily sound diet and lifestyle changes, essentially because some of our modern diet and lifestyle choices accelerate aging a lot. But diet and lifestyle changes probably will not make people live to 150.

If we want to become immortal, as we understand it in our current human form, ultimately we may want to beat evolution. In this sense, only very intelligent beings can become immortal.

Maybe we can achieve that by changing our genes, or by learning how to transfer our consciousness “software” into robots. In doing so, however, we may become something different; something that is not human and thus doesn’t see things in the same way as a human does. A conscious robot, without the hormones that so heavily influence human behavior, may find that being alive is pointless.

There is another problem. What if the only natural way to achieve some form of immortality is through organic death, but in a way that we don’t understand? This is not a matter of faith or religion. There are many things that we don’t know for sure. This is probably the biggest mystery of all; one that we cannot unravel in our current human state.

Thursday, January 6, 2011

Does strength exercise increase nitrogen balance?

This previous post looks at the amounts of protein needed to maintain a nitrogen balance of zero. It builds on data about individuals doing endurance exercise, which increases the estimates a bit. The post also examines the issue of what happens when more protein than is needed in consumed; including by people doing strength exercise.

What that post does not look into is whether strength exercise, performed at the anaerobic range, increases nitrogen balance. If it did, it may lead to a counterintuitive effect: strength exercise, when practiced at a certain level of intensity, might enable individuals in calorie deficit to retain their muscle, and lose primarily body fat. That is, strength exercise might push the body into burning more body fat and less muscle than it would normally do under calorie deficit conditions.


(Strength exercise combined with a small calorie deficit may be one of the best approaches for body fat loss in women. Photo source: complete-strength-training.com)

Under calorie deficit people normally lose both body fat and muscle to meet caloric needs. About 25 percent of lean body mass is lost in sedentary individuals, and 33 percent or more in individuals performing endurance exercise. I suspect that strength exercise has the potential to either bring this percentage down to zero, or to even lead to muscle gain if the calorie deficit is very small. One of the reasons is the data summarized on this post.

Two other reasons are related to what happens with children, and the variation in spontaneous hunger up-regulation in response to various types of exercise. The first reason can be summarized as this: it is very rare for children to be in negative nitrogen balance (Brooks et al., 2005); even when they are under some, not extreme, calorie deficit. It is rare for children to be in negative nitrogen balance even when their daily consumption of protein is below 0.5 g per kg of body weight.

This suggests that, when children are in calorie deficit, they tend to hold on to protein stores (which are critical for growth), and shift their energy consumption to fat more easily than adults. The reason is that developmental growth powerfully stimulates protein synthesis. This leads to a hormonal mix that causes the body to be in anabolic state, even when other forces (e.g., calorie deficit, low protein intake) are pushing it into a catabolic state. In a sense, the tissues of children are always hungry for their building blocks, and they do not let go of them very easily.

The second reason is an interesting variation in the patterns of spontaneous hunger up-regulation in various athletes. The increase in hunger is generally lower for strength than endurance activities. The spontaneous increase for bodybuilders is among the lowest. Since being in a catabolic state tends to have a strong effect on hunger, increasing it significantly, these patterns suggest that strength exercise may actually contribute to placing one in an anabolic state. The duration of this effect is approximately 48 h. Some increase in hunger is expected, because of the increased calorie expenditure during and after strength exercise, but that is counterbalanced somewhat by the start of an anabolic state.

What is going on, and what does this mean for you?

One way to understand what is happening here is to think in terms of compensatory adaptation. Strength exercise, if done properly, tells the body that it needs more muscle protein. Calorie deficit, as long as it is short-term, tells the body that food supply is limited. The body’s short-term response is to keep muscle as much as possible, and use body fat to the largest extent possible to supply the body’s energy needs.

If the right stimuli are supplied in a cyclical manner, no long-term adaptations (e.g., lowered metabolism) will be “perceived” as necessary by the body. Let us consider a 2-day cycle where one does strength exercise on the first day, and rests on the second. A surplus of protein and calories on the first day would lead to both muscle and body fat gain. A deficit on the second day would lead to body fat loss, but not to muscle loss, as long as the deficit is not too extreme. Since only body fat is being lost, more is lost on the second day than on the first.

In this way, one can gain muscle and lose body fat at the same time, which is what seems to have happened with the participants of the Ballor et al. (1996) study. Or, one can keep muscle (not gaining any) and lose more body fat, with a slightly higher calorie deficit. If the calorie deficit is too high, one will enter negative nitrogen balance and lose both muscle and body fat, as often happens with natural bodybuilders in the pre-tournament “cutting” phase.

In a sense, the increase in protein synthesis stimulated by strength exercise is analogous to, although much less strong than, the increase in protein synthesis stimulated by the growth process in children.

References

Ballor, D.L., Harvey-Berino, J.R., Ades, P.A., Cryan, J., & Calles-Escandon, J. (1996). Contrasting effects of resistance and aerobic training on body composition and metabolism after diet-induced weight loss. Metabolism, 45(2), 179-183.

Brooks, G.A., Fahey, T.D., & Baldwin, K.M. (2005). Exercise physiology: Human bioenergetics and its applications. Boston, MA: McGraw-Hill.